

MANNARINO: Dow/Gold Ratio and Stock Market Crashes
MANNARINO: Dow/Gold Ratio and Stock Market Crashes
Central bank monetary policy IS THE number one driver of the markets

NOTE TO READERS: The following is one of dozens of economic articles found in this week’s issue of The Trends Journal. Consider subscribing here for in-depth, independent geopolitical and socioeconomic trends and trend forecasts that you won’t find anywhere else.
By Gregory Mannarino, TradersChoice.net
Cash moves through the markets in predictable patterns, and central bank monetary policy is solely responsible for driving cash either into, or out of, certain assets.
Central bank monetary policy IS THE number one driver of the markets.
Period.
As an example.
After the stock market meltdown/financial crisis of 2008, the Federal Reserve implemented what has become known as quantitative easing. Quantitative easing is defined as: “the introduction of new money into the money supply by a central bank.”
This QE process involves VAST purchases of debt by a central bank, AND MASSIVE ISSUANCE of debt, (the currency itself being units of debt).
CELENTE: WORST IS YET TO COME, AND IT’S COMING SOON
Quantitative Easing initiates a revolving door mechanism by which a central bank issues debt via one door, and then buys it back through another.
At its core, QE allows a central bank to vastly inflate the overall debt, which is of course their overall goal. The more debt a central bank issues, the stronger they become.

QE then via this mechanism artificially pushes bond yields lower, and this in turn opens a doorway for cash to make its way into risk assets/stocks, therefore inflating stock market bubbles.
QE hyperinflates the money supply/overall debt, which is massively currency purchasing power negative. With that, it is only a matter of time before all those extra bills, in whatever form they exist, make their way through the system.
The result is inflation, AND MASSIVE price action distortions across the entire spectrum of asset classes.
Quantitative easing is responsible for inflating stock market and real estate bubbles. QE is also responsible for creating inverse bubbles as well.
When a central bank initiates QE, cash is pulled from other asset classes, more specifically commodities, resulting in enormous undervaluing of these assets.
This undervaluing of assets then creates the opportunity to buy commodities “ON SALE,” or at a huge discount.
Understanding that QE/Easy Money Policy/Suppressed Rates/Currency Devaluation, drives cash either into or out of certain assets, we can look at gold, or more specifically the DOW Gold Ratio, to gauge how extreme these central bank induced price action distortions are.
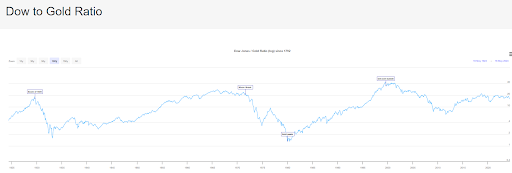
Just prior to the stock market crash of 1929 which led to the Great Depression, the DOW/Gold ratio peaked at around 18 (meaning that it took 18 ounces of gold to equal the DOW).
During the Great Depression, the DOW/Gold ratio fell to 1.59, meaning it took 1.59 ounces of gold to equal the DOW. In 1980, the DOW/Gold Ratio fell again to 1.35. Just prior to the Dotcom stock market crash, the DOW/Gold Ratio was 42! Which then after the crash dropped to 6.7.
Today, the DOW/Gold ratio sits at around 17, very close to where it was just prior to the 1929 stock market crash.
Below is a long-term chart of the DOW/Gold ratio. (Courtesy of Longtermtrends.com)
The ratio may be an indicator but it is not the underlying cause of the coming crash. To grasp the physical laws being violated by financiers which by the way have caused every financial crash in history, watch Lyndon LaRouche;s Triple Curve Collapse Function.